![]() East-West Gateway Council of Governments’ (EWG) transportation safety initiative focuses on providing a safer transportation system for all users. As part of EWG’s long-range transportation planning process, safety was listed as one of the Guiding Principles in the Long-Range Transportation Plan, Connected 2050.
East-West Gateway Council of Governments’ (EWG) transportation safety initiative focuses on providing a safer transportation system for all users. As part of EWG’s long-range transportation planning process, safety was listed as one of the Guiding Principles in the Long-Range Transportation Plan, Connected 2050.
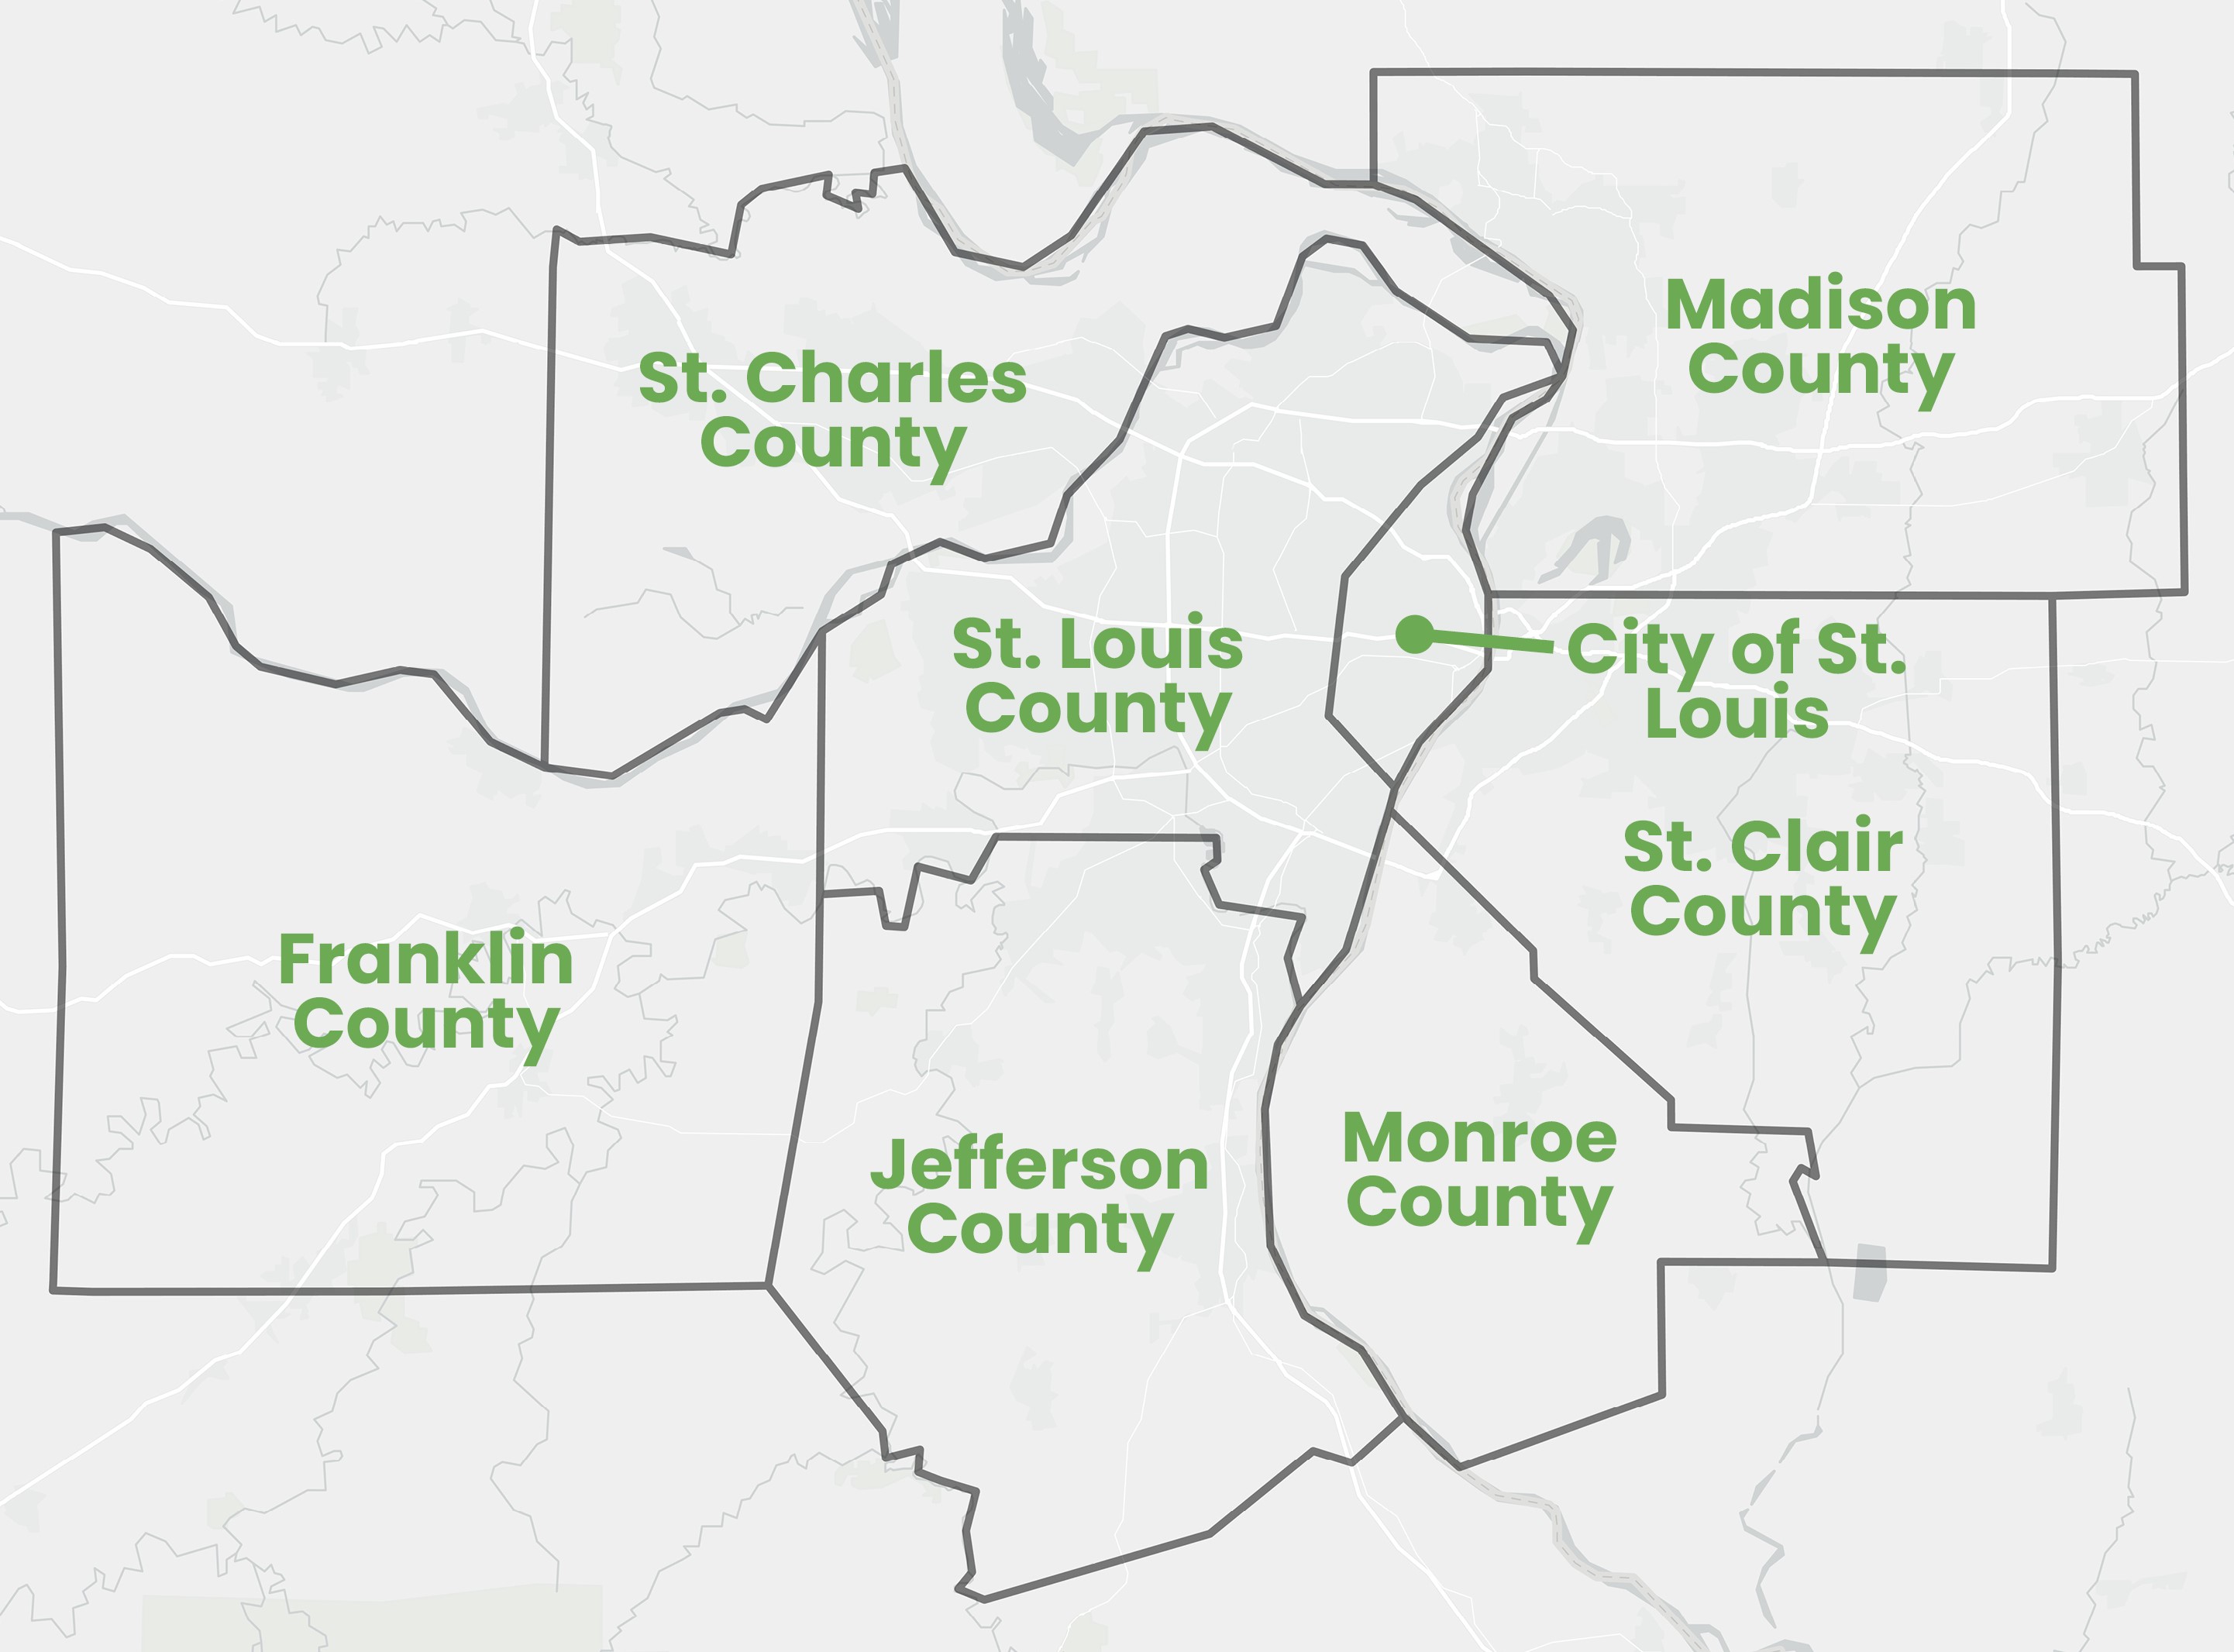
Click on map to enlarge.
EWG tracks the progress of transportation safety to ensure that investments in the transportation system reduce both traffic fatalities and serious injuries in absolute terms, but also that crash rates decrease over time to provide a safer transportation system for all users.
In order to make progress towards a downward trend in fatal and serious injury crashes, EWG in partnership with CBB Transportation Engineers + Planners and regional safety stakeholders, developed the Gateway to Safer Roadways: St. Louis Regional Safety Action Plan (Action Plan).
The Action Plan is both a call to action and a blueprint for how the Region can significantly reduce the number of people killed and seriously injured on roadways. Roadway fatalities and serious injuries are a serious public health and safety problem in the United States. The fatalities and serious injuries that result from roadway crashes are preventable and thus unacceptable. The Action Plan provides a collaborative approach to improve roadway safety equitably for motorized and non-motorized users.
St. Louis Regional Safety Action Plan Appendices
Download All Files (zip)

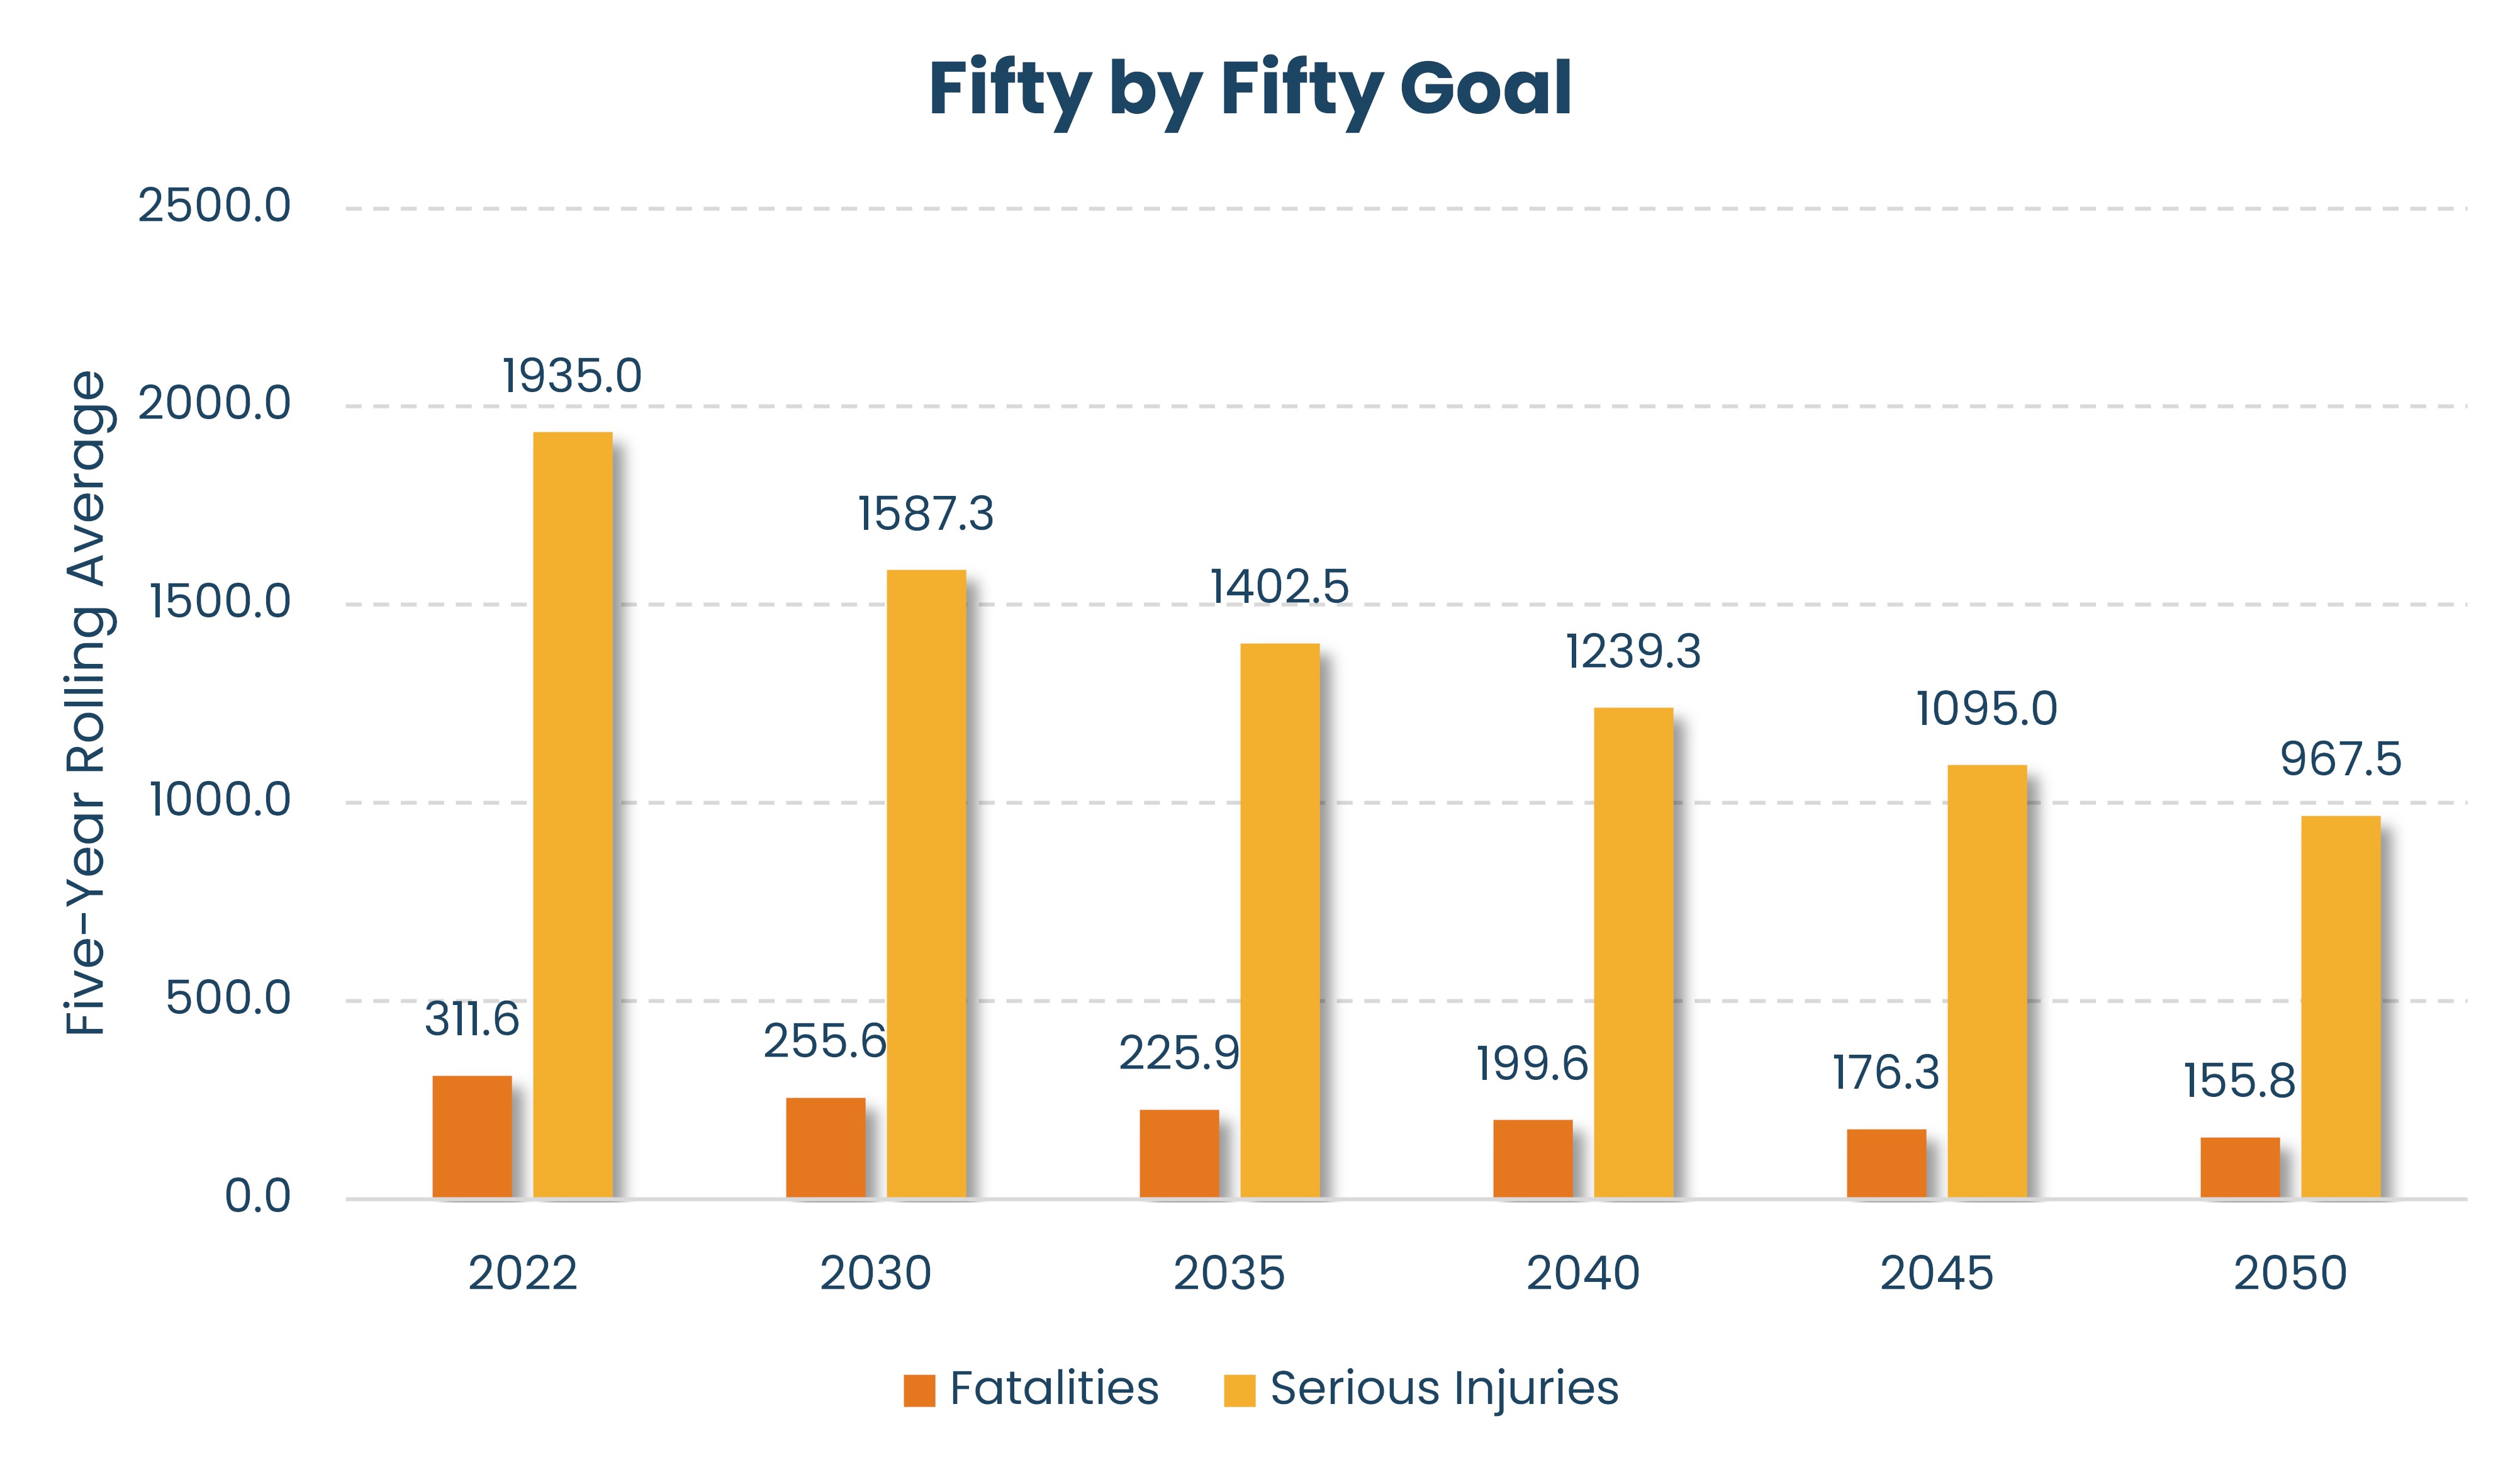
EWG is committed to an eventual goal of zero fatalities and serious injuries resulting from crashes on the surface transportation system. As a first step towards this goal, the Action Plan sets a target to reduce the number of fatalities and serious injuries resulting from roadway crashes in the EWG Region by 50% by 2050. While ambitious, this target is achievable through a concentrated, coordinated, and sustained effort.
For more detail on our Fifty by Fifty Goal, go to page 147 of the Action Plan.
Data from 2018 to 2022 was gathered for all crashes in the EWG Region.
The obtained data includes all crashes occurring on public roadways that involve a fatality, injury, or property damage. Severity ratings are assigned by the responsible agencies based on the presence and significance of an injury resulting from the crash.

For a deeper dive into the data, go to page 26-43 of the Action Plan.
Total Crashes in EWG Region
Over the span of 2018 to 2022, a total of 349,528 crashes occurred in the EWG Region. On average over 69,000 crashes occurred each year, or about 200 crashes per day. The chart below is a visual representation of the total number of crashes in each of the eight counties in the EWG Region during this period. Notably, St. Louis County reported the highest number of crashes, accounting for approximately 41% of the Region’s total, followed by City of St. Louis with 21%.

Fatal and Serious Injury Crashes in the EWG Region
This chart summarizes the fatal and serious injury crashes for each county in the Region. Similar to the total crashes, St. Louis County had the most fatal and serious injury crashes followed by City of St. Louis.

Comparison of Pedestrian-Involved Crashes in the EWG Region
This chart compares pedestrian-involved crashes to crashes by severity in the EWG Region. Although pedestrian-involved crashes only account for 1% of all crashes happening in the Region, they account for 11% of all fatal and serious injury crashes and 20% of all fatal crashes in the Region.

Top 5 Contributing Factors of Fatal & Serious Injury Crashes in the EWG Region
When analyzing fatal and serious injury crashes, it is vital to understand the underlying reasons for these occurrences. To gain insights into the human risk factors involved in such crashes, contributing circumstances were extracted and summarized from the crash data. In the EWG Region from 2018-2022, the contributing circumstances reveal that speeding-related issues were the primary cause of serious and fatal crashes, accounting for 30% of all incidents.

Comparison of Population and Fatal and Serious Injury Crashes in Climate EJST Areas in the EWG Region
In the EWG Region, only 18% of the Region’s population lives in disadvantaged areas, yet nearly 40% of fatal and serious crashes occur in disadvantaged areas. This shows that CEJST areas have a much higher exposure to fatal and serious injury crashes compared to non-disadvantaged communities. The trend generally continues at the county levels as well, with the largest disparities occurring in City of St. Louis, St. Louis County, and St. Clair County.

To identify the roadways with the highest frequencies of fatal and serious injury crashes are occurring in the EWG Region, a series of high-injury networks (HINs) were developed. The high-injury networks synthesize the crash data points into a scoring of the frequency of crashes across a particular location. For example, the map listed below shows all fatal and serious injury crash locations on all roadways in the EWG Region from 2018 to 2022. The second map below shows the high-injury network for all non-interstate roads in the EWG Region, which used the crash data points from the map to the right and ranked the corridors with the most occurrences of fatal and serious injury crashes.


Regional high-injury networks were generated for the following focus areas:
- All Roads and Modes, Except Interstates and Ramps (HIN 1 - All Modes)
- Only Vulnerable Road Users (HIN 2 - VRU)
- Pedestrians
- Bicyclists
- Underserved Communities (HIN 3 - Underserved)
- Top Contributing Factors (HIN 4 – Contributing Factors)
- Speeding
- Failing to Yield Right-of-Way
- Improper Lane Usage
- Alcohol/Drug Use (Impaired Driving)
- Distraction (Distracted Driving)
- Interstates and Ramps (HIN 5 – Interstates)
Detail on all 5 HINs can be found on pages 44-63 in the Action Plan and all 5 HINs can be found in the interactive map above.
To meet the goal of reducing the number of fatalities and serious injuries resulting from roadway crashes in the EWG Region by 50% by 2050, EWG will monitor and report the five-year rolling average for fatalities and serious injuries in the Region. This data can be found in the dashboard below.
EWG will also use annual targets set in Table 1 in Appendix C to track the fatalities and serious injuries five-year rolling averages to show if the Region meets the goal set for each year. The full table and more detail on Measuring and Tracking can be found in Appendix C of the Action Plan. Below is an abbreviated version of the table, this table highlights key years in the implementation of the Action Plan.
| Year | Fatalities | Serious Injuries |
|---|---|---|
| Annual Targets (Five-Year Rolling Average) |
||
| 2022 (baseline) | 311.6 | 1935.0 |
| 2030 | 255.6 | 1587.3 |
| 2035 | 225.9 | 1402.5 |
| 2050 | 155.8 | 967.5 |
Roadway Safety Resources
Missouri
Illinois
Federal Highway Administration (FHWA)
Local Transportation Officials
SS4A Grant How-To Documents